
See the portfolio
Compare whole-building and riser-level water performance from one private cloud view.
Find the leak on the line, not by searching the building. Live Water and Live Riser show where consumption changes, when it starts and what needs attention.
Real-time water data
Know the day a leak starts.Live Building Systems connects smart meters to the Live Buildings Cloud so property teams can see consumption in real time, identify the affected line and verify that repairs worked.
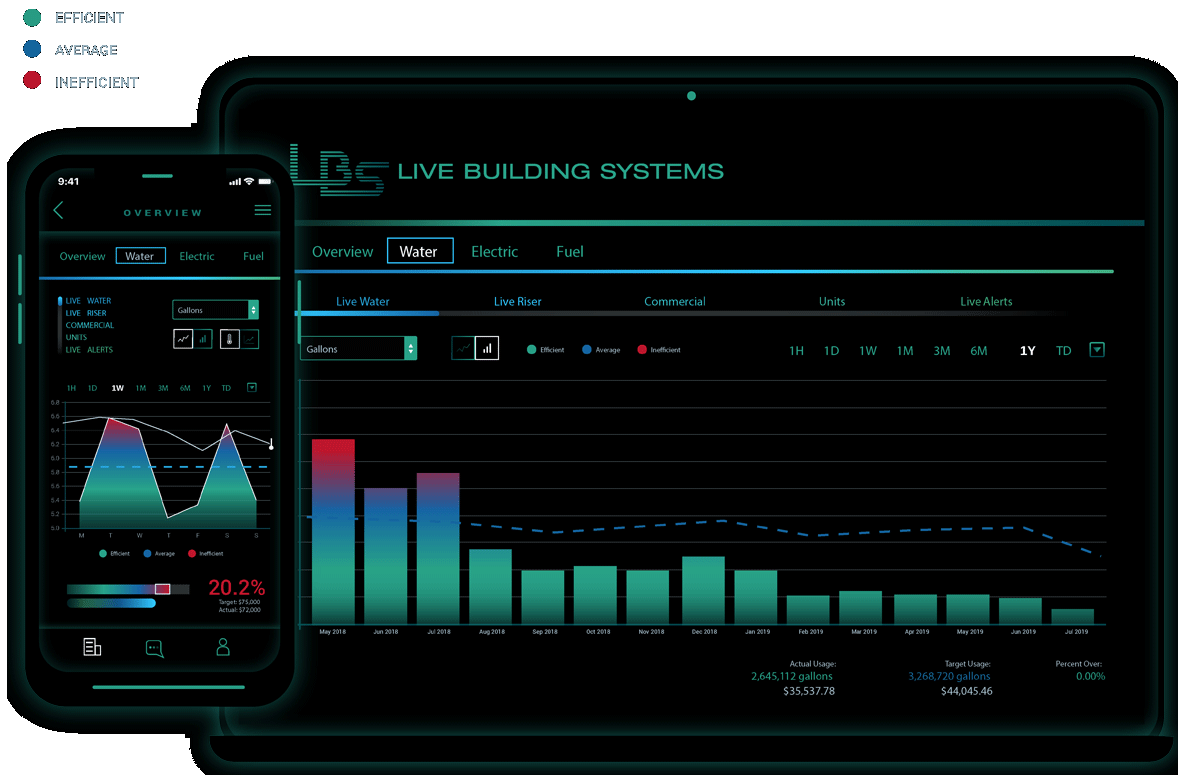
Compare whole-building and riser-level water performance from one private cloud view.
Use granular consumption data to narrow an inspection before sending staff across every unit.
Watch usage return to baseline and document the response with reports and historical data.
Start with existing utility data or add smart metering where more detail is needed. Live Building Systems supports software, hardware, monitoring and field services.
Track whole-building water consumption in real time, identify abnormal usage and verify repairs without waiting for the next bill.
Discuss this solutionUse line-by-line consumption data to narrow the search for running toilets and fixture leaks across multifamily properties.
Discuss this solutionPair smart metering with a dedicated data analyst, weekly reports and high-consumption alerts for faster follow-through.
Discuss this solutionReview utility billing and current meter conditions to understand whether metered conversion deserves a closer look.
Discuss this solutionHigh water costs can come from active leaks, meter conditions, billing discrepancies or the wrong rate structure for the property. LBS reviews utility accounts and current meter conditions to help ownership understand the next question to ask.
Request a free bill reviewRiser-level monitoring gave the property team a smaller, faster inspection path and a live view of consumption after repairs.
Average daily use
25–27k gallons per day before LBS riser submetering. 11,000 to 12,000 gallons per day after.Inspection scope
300 → 16 units narrowed to one affected riser lineSend a recent bill and we will show you where the signal is.
Source: 1500 Noble case study, Live Building Systems. Results vary by property, conditions and implementation.
Share recent utility bills, building size, unit count and current meter setup.
Connect available data and identify the buildings or lines that need more visibility.
Investigate the exception, document the repair and watch usage return toward baseline.
Tell us about the property and the change you are seeing. An LBS specialist can review the account, current meter setup and next steps.
(866) 954-4703Speak with a specialist